Daryl Guppy
Parabolic trends found in currencies
By Daryl Guppy (China Daily)
Updated: 2010-05-24 10:21
 |
Large Medium Small |

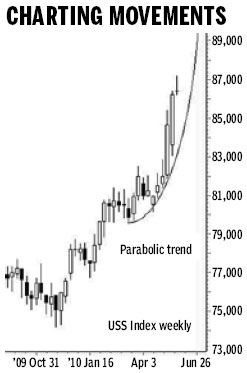
Nothing drives markets faster than fear. Markets move quickly often with cascading falls. In currency markets when one currency goes down then the other currency pair goes up. The Dollar Index has developed a particular type of trend behavior in recent weeks as concerns grow in the Euro zone. The dramatic dollar index rise from $0.81 to $0.87 is more than just a fast trend rise. It has developed a parabolic trend rise.
The parabolic trend has four important features. The first is the way it captures an acceleration in behavior. The trend starts slowly and then gathers speed, rapidly moving up with increasing volatility. This is not a bubble and it is not a rally. These have different behaviors.
The second feature is the shape of the parabolic trend rise. This is defined with a curved parabolic trend. This is not a true parabolic curve because as the trend accelerates the curve changes shape until it becomes vertical. It's the vertical section of the curve that is most useful because it provides an exact date when the trend will inevitably collapse.
The parabolic trend line uses three anchor points to start the definition of the trend line. Then the position and shape of the curve does not change. The vertical section of the curve remains fixed in time. Every day a new candle is added to the right of the previous days candle. Eventually, and inevitably, a candle will move to the right of the vertical section of the parabolic trend line and signal an end to the trend. This is the third feature of the parabolic trend line. The trend has a final ending date that can be calculated in advance using the vertical section of the trend line.
A normal straight trend line shows different market behavior. It shows a steady change in the investors' valuation of the stock. The normal trend line does not indicate when the trend will end.
The fourth feature of the parabolic trend line is the high probability of a very rapid collapse in the trend. A good example is the parabolic trend in the oil market in 2008. When this trend collapsed the price dropped from $145 to $90 in 13 weeks.
The Dollar Index has developed a parabolic trend. Using the behavior of this trend sets an end date for the trend about the end of June if the trend develops fully. The potential high for the dollar index is near $0.89. The trend could carry price above these levels towards 91 cents. The parabolic trend is not used to estimate price highs. It is used to identify the behavior of the trend and its collapse.


The trend collapse is often very rapid and with the dollar index this gives a downside target near $0.81. This target is based on the previous consolidation area. Additionally parabolic trend collapses often retrace 80 percent or more of the original trend rise.
The behavior of the parabolic trend line suggests there is a high probability of further rises in the Dollar Index followed by a substantial and rapid fall. This increase in currency volatility has been a feature of the currency market since 2008. Investors must learn to use effective currency hedging strategies.
The author is a well-known international financial technical analysis expert.