Daryl Guppy
Staying ahead of the elusive upward curves
By Daryl Guppy (China Daily)
Updated: 2010-06-28 09:49
 |
Large Medium Small |

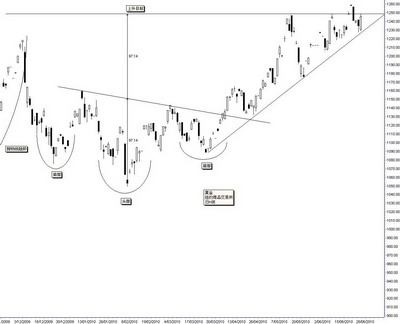
The gold chart brings together many behavioral features that help investors make better decisions. Technical analysis of price activity uses statistical analysis methods. Chart analysis uses chart patterns to understand the behavior of market participants.
The daily New York Mercantile Exchange gold chart shows three significant patterns. The first pattern is the parabolic trend. This develops when investors become increasingly excited about the market. These rapid rises are unsustainable and when the price retreat begins investors very quickly panic. They chase the market down, selling at any price because they are desperate to lock in a profit. It is a type of bubble pattern but it has the added advantage of signaling when the trend will collapse.
The move to the right of the parabolic trend line leads to a sudden and severe collapse. The gold price lost 13 percent very quickly. The recovery from this fall leads to the second behavioral pattern: the inverted head and shoulder pattern. The first rebound rally develops when impatient investors believe the market has fallen to good buying value. This buying creates the first inverted shoulder of the pattern.
A small rally develops but the rally is overwhelmed by sellers and the price drops even lower. Sellers who regret not selling during the first downtrend now sell because they are worried the rally will not continue. More patient investors buy at a lower price. The rally from this level creates the inverted head of the pattern.
The new rally is often weak and it also collapses. Investors who missed out entering at the very low of the downtrend now come into the market because they are eager to make up for their mistake. The results are that the retreat falls only a small distance before a new sustainable uptrend develops. This is the second inverted shoulder.

The importance of the pattern lies in the way it is used to project the next price target. The upside target for the gold inverted head and shoulder pattern was $1,250. This has been achieved. The behavior of the gold price after this target was achieved has created the third behavioral pattern: the upward sloping triangle. This starts with a horizontal resistance level near $1,250, which is the price target for the inverted head and shoulder pattern. The second part of the upward sloping triangle pattern is the sloping trend line. This defines the price rise starting in March, 2010. The third part of the triangle is the vertical base. This is created when the market falls in 2010 May to $1,177. The height of this base is measured and the value is projected upwards. This gives the next breakout target, near $1,319.
The triangle pattern shows investors are worried they will miss out on a new trend so they are prepared to pay a higher price to join in. This confidence is more stable than the excitement that creates the parabolic trend. Smart investors enter the gold market again as the rebound develops from the trend line and moves above the resistance level. The key indicators of the collapse of the trend are a move below the trend line.
The author is a well-known international financial technical analysis expert