Daryl Guppy
Learning the lessons of market history
By Daryl Guppy (China Daily)
Updated: 2010-07-12 09:40
 |
Large Medium Small |

History repeats itself, although the detail is always different. Its study shows patterns of broad behavior and the outcomes.
Financial markets are a creation of human behavior and they capture the fears, the hopes and the disappointments of a crowd of individuals. These emotions often manifest themselves in repeated patterns of behavior that appear as well defined chart patterns in market history.
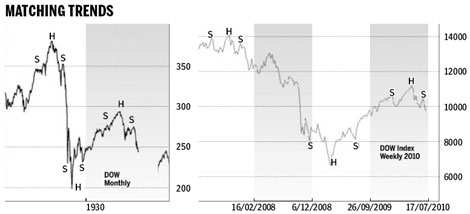
The debate about the development of a double dip in Western markets cannot be considered in historical isolation. The collapse in early 2008 followed the same behavioral patterns as the collapse in 1929. The causes were different and the traded instruments were different, but the behaviors were the same in 1929 as they were in 2008.
The pattern of recovery developed in much the same way and in 2010 has developed the same behavior as those that developed in 1930. Understanding these historical connections is a prelude to examining the continuing significance in current market developments.
The Dow collapse in 1929 was signaled by the development of a well defined head and shoulder pattern. This is most clearly seen on a monthly chart. The pattern is created by a series of three rallies and retreats developing over several months. The first rally and retreat creates the left shoulder.
The higher rally created the head and the third rally and retreat creates the right shoulder. The retreat lows in this pattern are joined by a trend similar to a neckline. The distance between the neckline and the head is measured and used to calculate downside targets. It is a reliable pattern that captures the behavior of investors who are becoming increasingly disillusioned about the future prospects for economic growth
The downside pattern targets in the 1929 Dow were exceeded with a fall of around 49 percent before the market recovered in 1930. The 2008 Dow fall developed after the same head and shoulder pattern. The pattern targets were also exceeded with a market fall of around 52 percent.
In 1930 the market developed a "V" shaped recovery that led to a 46 percent rise in the market. Better examination of the monthly chart shows this was an inverted head and shoulder rebound pattern.
| ||||
The historical development of the recovery in the Dow in 1930 ended with a new head and shoulder pattern. This developed between March 1930 and July 1930. The head and shoulder pattern was followed by a rapid market decline that created the first part of a long-term double dip pattern. This retreat also exceeded the pattern projection targets with a fall of 28 percent.
In current market conditions the Dow is developing a new head and shoulder pattern. The rally peaks in the Dow appear in January, May and June. The downside projection taken from the neckline of the pattern sets a target at 8400. This is a 25 percent decline.
A more bearish analysis using the pattern of retreat behavior in 1930 suggests the Dow in 2010 could retreat to around 7500 as the chart pattern targets are exceeded.
The continuity of market behavior in response to the 1929 and 2008 crashes cannot be ignored. The speed of market behavior and the size of the rally and retreats are different but the core behaviors remain the same. After the 1930 head and shoulder pattern collapse the Dow developed a sideways pattern of behavior prior to a fall below the 1929 low.
This was an extreme double dip. Armed with a knowledge of history, traders and investors can identify the confluence or divergence of market behaviors and take appropriate action. Markets do not have to repeat history but, when they, do investors need to pay attention.
The author is a well-known international financial technical analysis expert


