Daryl Guppy
The search for golden opportunities
By Daryl Guppy (China Daily)
Updated: 2010-09-27 10:30
 |
Large Medium Small |
There is nothing like economic uncertainty to propel the price of gold higher. Three fears continue to dominate the US and these have combined to push up the price of gold to new highs.
The first fear is the slowness of the economic recovery. Economic momentum is slow and erratic. Some investors have growing concerns about the long-term future of American economic growth so they turn to gold as a protective hedge.

The second fear is the potential to undermine the US dollar through another round of quantitative easing. This devalues the US dollar by printing more money. Gold is used as a safe haven in this situation as people shift out of dollar assets and into physical gold.
The third fear is the continuing weakness in the US dollar as measured by the US Dollar Index. This is good for US exporters - something the current political debate often ignores - but it adds to the climate of fear.
Fear adds impetus to the gold price but impetus is accelerated by speculative trading activity. Most people do not trade physical gold if they want exposure to this market. They trade gold derivatives, including Exchange Traded Notes, which form the basis of several gold-linked Exchange Traded Fund products. They trade gold on the futures exchange and use a variety of other derivative instruments.
The increase in derivative trading is a new demand-and-supply factor in the gold market in addition to the demand from hoarders and industry users. This type of derivative style trading was seen in the oil market and helped to push price to all-time highs. When fear retreats, the derivative positions change and these changes feed through to the physical market. The interaction between the derivative market and the physical market accelerates trends that may start as a result of other factors. This makes gold a good trading instrument and makes it less reliable as an investment instrument.
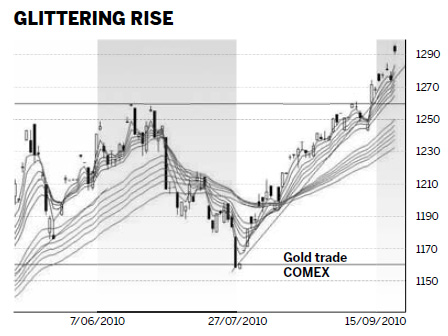
The daily New York Mercantile Exchange Gold chart shows a continuation of the uptrend after a temporary trend weakness. The $1,260 resistance level was the target level for the inverted head and shoulder pattern that developed between December 2009 and March 2010. The reaction away from this target level created and tested a new resistance and support level near $1,160. This test created a broad trading band and this is used to help calculate upside targets for the current uptrend breakout.

The trend rally from support at $1,160 to resistance near $1,260 is defined with an uptrend line. The strong rebound upward move starting on Sept 14 was very bullish and has confirmed the development of a new sustainable uptrend. The uptrend line starting in July 28 is used to define the continuation of the uptrend as the price moves towards the next target level at $1,355
The target level is calculated by measuring the width of the trading band between $1,160 and $1,260. This value is projected upward and gives an upside target near $1,355. The gold price may bubble above the uptrend line but it is important that the uptrend line provides a successful support level. Any close below the value of the trend line is an exit signal.
| |||||||
The strength of the longer-term trend is shown by the degree of consistent separation between the short-term GMMA and the long-term GMMA. This has remained constant and this is usually associated with a strong and sustainable trend.
Traders and investors tighten the stop-loss conditions as gold moves towards the initial price target at $1,355.
The author is a well-known international financial technical analysis expert.


