Daryl Guppy
Why gold may be losing its glitter
By Daryl Guppy (China Daily)
Updated: 2011-01-24 10:25
 |
Large Medium Small |

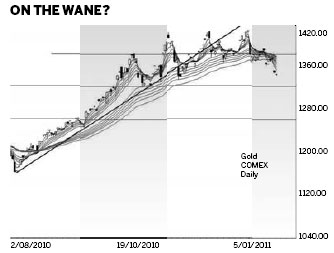
Gold prices continue to move toward new lows after hitting a high near $1,420. Several features show the first significant change in the gold trend since the recent strong upward trend began in July 2010. This is a contradictory behavior because many fundamental factors support a continuation of the upward trend.
There are four features that indicate a significant change in the upward trend. The first is the strength of resistance near $1,420. The price moved to this level three times between November and December 2010. Each time the price retreated from the $1,420 area. This creates a triple-top pattern. This is usually seen as a very strong trend-reversal pattern.
The second feature is the upward trend line starting from the low in July last year. This line defined the strong trend until November 2010. Price used the trend line as a support level. After November the price used the trend line as a resistance level. This was the first early warning of a developing trend change. A move below a well established trend line is bearish.
The third feature is the relationship between the components of the Guppy Multiple Moving Average. This technical indicator tracks the inferred behavior of traders and investors. For the first time since July last year the long-term group of averages has compressed. This suggests that investors have become sellers. They are joining the traders who have also become sellers. This combination of events is often associated with a significant change in the trend.
The fourth feature supporting a trend change is the recent strength in the US dollar. This is also the first of the fundamental features which suggests a rise in the gold price. The US dollar Index has moved from its November 2010 low at $0.75 and has developed a consolidation pattern near $0.79. This was a change in the direction of the trend for the US Dollar Index. The current dollar weakness may be short term. A strong dollar is bearish for gold, and this helps to confirm the trend change observed on the gold chart.
| ||||
Inflationary pressures are also developing in hard and soft commodity markets. The hard commodity market includes base metals and other industrial resources such as coking coal. The recent floods in Australia have added to this pressure with restrictions on the supply of coking coal. The soft commodities include soya beans, wheat, rice and other foodstuffs. The food inflation measures uses by the United Nations have already hit an all time high.
In an inflationary environment there is usually strong upward trend in gold. This does not appear to be happening with the current gold price activity.
The third feature supporting a rise in the gold price is large-scale buying by some central banks. This reduces the supply of physical gold and creates upward pressure on prices. The activity of some exchange-traded commodity funds also means increased pressure on bullion. This reduces supply and acts to increase the upward pressure on price. This is a simple demand-and-supply equation and it has a bullish impact.
The chart signals are contrary to the fundamental factors. When these contradictions occur many investors prefer to take the signals from the chart activity because this brings together all of the diverse factors in the market. In the short term, many investors are locking in profits, or trading short. However, the fundamental features keep them alert for a change in the trend so they are ready to take new long positions.
The author is a well-known international financial technical analysis expert

| 分享按钮 |


