Chinese universities in Times' rankings


LONDON - The Times Higher Education in June published its World Reputation Rankings, the list of the world's most prestigious universities compiled from research insight from leading global academics.
Harvard University takes the top spot for the seventh year in a row. With 42 institutions in the top 100, the United States continues to dominate. Chinese universities also enjoyed a good run in this year's rankings.
Tsinghua University is the highest ranking Chinese university, placing 14th, and is the second most prestigious Asia-Pacific university. The third is Peking University, which is 17th overall. Both have gained four places compared with last year's index.
Zhejiang University has performed well, rising 30 places to the joint 51-60 bracket. It overtook both Fudan University and Shanghai Jiao Tong University, both found in the 81-90 band. Nanjing University has broken into the top 100 for the first time and is ranked 91-100.
The University of Hong Kong features in the top 40 for the first time in five years after climbing six places to joint 39th. The Chinese University of Hong Kong and Hong Kong University of Science and Technology are in the 71-80 band.
In total, the Asia-Pacific has 28 institutions in the ranking, with Japan's University of Tokyo the highest in the region in 11th place.
Phil Baty, Times Higher Education rankings editor, spoke highly of Chinese universities' performance this year. "A striking feature of the World Reputation Rankings is the continued rise of China."
According to the Times, its World Reputation Rankings are created using the world's largest invitation-only academic-opinion survey - a unique piece of research. The Academic Reputation Survey, available in 15 languages, uses United Nations data as a guide to ensure that the response coverage is as representative of world scholarship as possible. It is also evenly spread across academic disciplines.
The questionnaire, which is administered on behalf of the Times by Elsevier, targets only experienced, published scholars, who offer their views on excellence in research and teaching within their disciplines and at institutions with which they are familiar. The 2017 rankings are based on a survey carried out between January and March, which received 10,566 responses.
Times Higher Education is one of the world's most authoritative sources of information about higher education.
Xinhua

Read more:
Methodology of The Times Higher Education World University Rankings are the only global performance tables that judge research-intensive universities across all their core missions: teaching, research, knowledge transfer and international outlook. The Asia University Rankings use the same 13 performance indicators to provide comprehensive and balanced comparisons.
The performance indicators are grouped into five areas:
• Teaching (the learning environment)
• Research (volume, income and reputation)
• Citations (research influence)
• International outlook (staff, students and research)
• Industry income (knowledge transfer)
Exclusions
Universities are excluded from the World University Rankings if they do not teach undergraduates or if their research output amounted to fewer than 1,000 articles between 2011 and 2015 (and a minimum of 150 a year). Universities can also be excluded if 80 per cent or more of their activity is exclusively in one of the eight subject areas.
Data collection Institutions provide and sign off on their institutional data for use in the rankings. On the rare occasions when a particular data point is not provided – which affect only low-weighted indicators such as industrial income – the ranking enters a low estimate between the average value of the indicators and the lowest value reported: the 25th percentile of the other indicators. By doing this, the ranking avoids penalizing an institution too harshly with a “zero” value for data that it overlooks or does not provide, but the ranking does not reward it for withholding the data.
Getting to the final result
Moving from a series of specific data points to indicators, and finally to a total score for an institution, requires the ranking to match values that represent fundamentally different data. To do this the ranking uses a standardization approach for each indicator, and then combines the indicators in the proportions indicated to the right. The standardization approach the ranking uses is based on the distribution of data within a particular indicator, where the ranking calculates a cumulative probability function, and evaluates where a particular institution’s indicator sits within that function. A cumulative probability score of X in essence tells us that a university with random values for that indicator would fall below that score X per cent of the time.
For all indicators except the Academic Reputation Survey the ranking calculates the cumulative probability function using a version of Z-scoring. The distribution of the data in the Academic Reputation Survey requires the ranking to add an exponential component.
Teaching (the learning environment): 25%
• Reputation survey: 10%
• Staff-to-student ratio: 4.5%
• Doctorate-to-bachelor’s ratio: 2.25%
• Doctorates-awarded-to-academic-staff ratio: 6%
• Institutional income: 2.25%
The most recent annual Academic Reputation Survey that underpins this category was carried out in January to March 2016, attracting 10,323 responses. It examined the perceived prestige of institutions in teaching. The responses were statistically representative of the school’s global geographical and subject mix. The 2016 data are combined with the results of the 2015 survey, giving more than 20,000 responses.
As well as giving a sense of how committed an institution is to nurturing the next generation of academics, having a high proportion of postgraduate research students also suggests the provision of teaching at the highest level that is attractive to graduates and effective at developing them. This indicator is normalized to take account of a university’s unique subject mix, reflecting that the volume of doctoral awards varies by discipline.
Institutional income is scaled against academic staff numbers and normalized for purchasing-power parity. It indicates an institution’s general status and gives a broad sense of the infrastructure and facilities available to students and staff.
Research (volume, income and reputation): 30%
• Reputation survey: 15%
• Research income: 7.5%
• Research productivity: 7.5%
The most prominent indicator in this category looks at a university’s reputation for research excellence among its peers, based on the responses to the annual Academic Reputation Survey (see above).
Research income is scaled against academic staff numbers and adjusted for purchasing-power parity (PPP). This is a controversial indicator because it can be influenced by national policy and economic circumstances. But income is crucial to the development of world-class research, and because much of it is subject to competition and judged by peer review, the ranking's experts suggested that it was a valid measure. This indicator is fully normalized to take account of each university’s distinct subject profile, reflecting the fact that research grants in science subjects are often bigger than those awarded for the highest-quality social science, arts and humanities research.
To measure productivity the ranking counts the number of papers published in the academic journals indexed by Elsevier’s Scopus database per scholar, scaled for institutional size and normalized for subject. This gives a sense of the university’s ability to get papers published in quality peer-reviewed journals.
Citations (research influence): 30%
The ranking's research influence indicator looks at a university’s role in spreading new knowledge and ideas.
The ranking examines research influence by capturing the number of times a university’s published work is cited by scholars globally. This year, the bibliometric data supplier Elsevier examined more than 56 million citations of 11.9 million journal articles, conference proceedings and books and book chapters published over five years. The data include the 23,000 academic journals indexed by Elsevier’s Scopus database and all indexed publications between 2011 and 2015. Citations to these publications made in the six years from 2011 to 2016 are also collected.
The citations help to show how much each university is contributing to the sum of human knowledge: they tell us whose research has stood out, has been picked up and built on by other scholars and, most importantly, has been shared around the global scholarly community to expand the boundaries of our understanding, irrespective of discipline.
The data are normalized to reflect variations in citation volume between different subject areas. This means that institutions with high levels of research activity in subjects with traditionally high citation counts do not gain an unfair advantage.
The ranking has equally blended country-adjusted and non-country-adjusted raw measure of citations scores.
In 2015-16, we excluded papers with more than 1,000 authors because they were having a disproportionate impact on the citation scores of a small number of universities. This year, the ranking has designed a method for reincorporating these papers. Working with Elsevier, the ranking has developed a new fractional counting approach that ensures that all universities where academics are authors of these papers will receive at least 5 per cent of the value of the paper, and where those that provide the most contributors to the paper receive a proportionately larger contribution.
International outlook (staff, students, research): 7.5%
• International-to-domestic-student ratio: 2.5%
• International-to-domestic-staff ratio: 2.5%
• International collaboration: 2.5%
The ability of a university to attract undergraduates, postgraduates and faculty from all over the planet is key to its success on the world stage.
In the third international indicator, the ranking calculates the proportion of a university’s total research journal publications that have at least one international co-author and reward higher volumes. This indicator is normalized to account for a university’s subject mix and uses the same five-year window as the “Citations: research influence” category.
Industry income (knowledge transfer): 7.5%
A university’s ability to help industry with innovations, inventions and consultancy has become a core mission of the contemporary global academy. This category seeks to capture such knowledge-transfer activity by looking at how much research income an institution earns from industry (adjusted for PPP), scaled against the number of academic staff it employs.
The category suggests the extent to which businesses are willing to pay for research and a university’s ability to attract funding in the commercial marketplace – useful indicators of institutional quality.
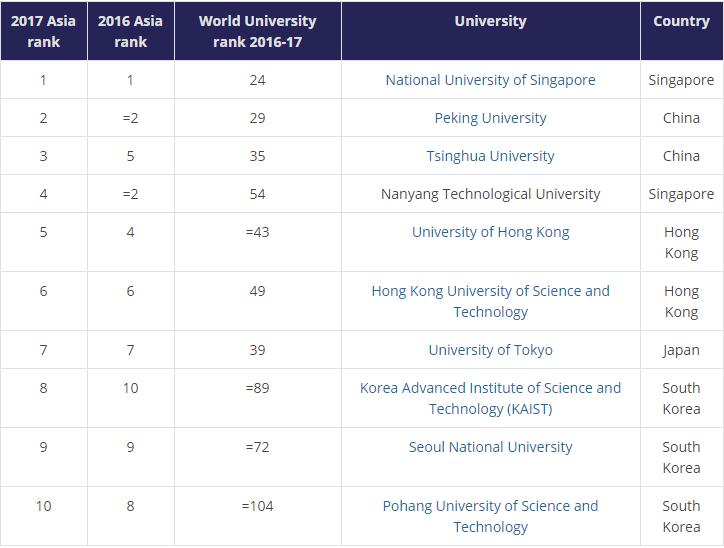 |
| Top 10 of Asia University World Rankings 2017 |