
The 2016 national high-tech zone innovation evaluation report, which was co-written by the Ministry of Science and Technology torch high-tech center and the national high-tech zone center, was released at the second innovation and entrepreneurship week on Oct 15 in Beijing.
Through vertical and horizontal analysis of the national high-tech zone innovation index, the report indicated the effectiveness and deficiencies of over 147 national high-tech zones in 2015, in terms of innovative resources, environment, performance, globalization and development.

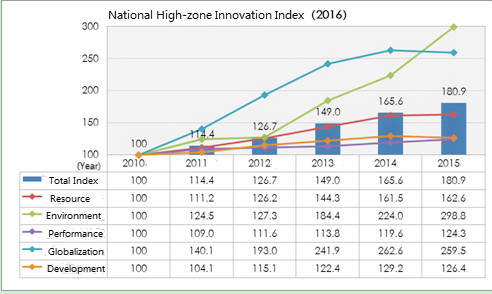
Chart I National high-zone innovation index in 2016.

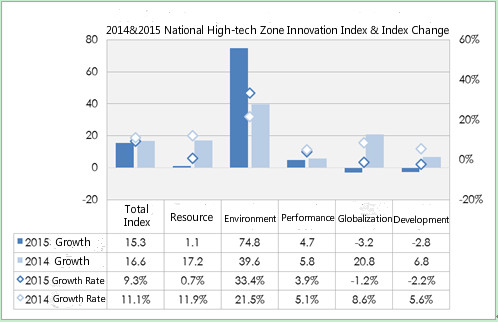
Chart II National high-zone innovation index from 2014 to 2015 and how it changes with a fluctuating range of index.
The national high-tech innovation index maintained steady growth from 2010 to 2014. The 2015 composite index was 180.9 points, 15.3 points higher than the 2014 level. Charts I and II depict a sustained growth for the past six years, including in innovative resources, environment and performance; they also show a slight downwards trend in innovative globalization and development.
The index of those five items was 162.6 points, 298.8 points, 124.3 points, 259.5 points and 126.4 points respectively. The largest year-on-year growth among them was in innovative environment, at 33.4 percent.

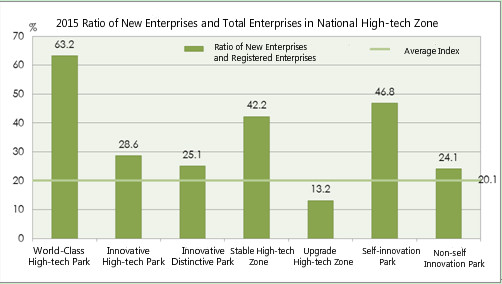
Chart III Ratio of new enterprises and total enterprises in national high-tech zones in 2015.
National high-tech zones created innovation friendly environments and stimulated innovative potentials in all dimensions. Out of a total of 1,074 mass innovation spaces set up in 2015, 230 were noted by the Ministry of Science and Technology. The venture capital of enterprises in the high-tech zone increased from last year.