
The number of patents obtained per ten thousand people in national high-tech zones in chart IV indicated that innovative production efficiency had reached an internationally leading level. The number of patentsobtained was 8.7 times and 1.9 times higher than the national and Silicon Valley levels in 2015.

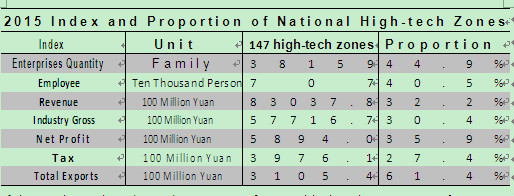
Chart V Index and proportion of national high-tech zones in 2015

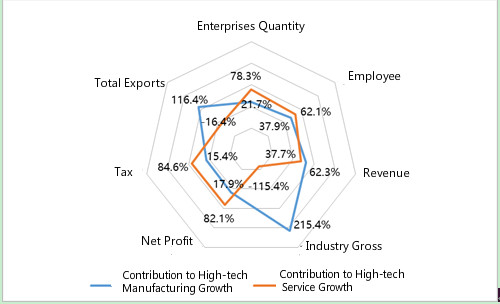
Chart VI Proportion of contribution to high-tech manufacturing growth and service growth in 2015.
As the main carrier of national high-tech industry, national high-tech zones have become increasingly significant.
The high-tech service industry in national high-tech zones creates jobs, expands employment and brings in economic benefits. Chart VI shows that the number of high-tech service enterprises was more than double that of manufacturing enterprises in national high-tech zones last year. In addition, the increases in the number of high-tech service employees and tax revenue were 3.2 and 5.2 times higher than those for the manufacturing industries. The gross profit of high-tech service enterprises was 3.9 percent higher than the manufacturing level.