Top Biz News
Cup trend bodes well for markets
By Daryl Guppy (China Daily)
Updated: 2009-12-22 08:00
 |
Large Medium Small |
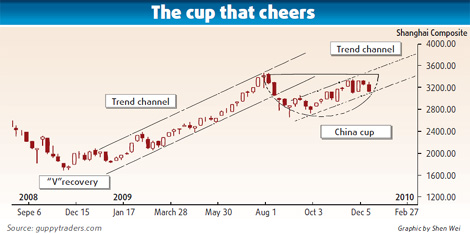
The Shanghai index shows a powerhouse economy. Looking at the weekly chart of the Shanghai index, this is the only global market, which showed a true, and powerful 'V' shaped recovery in 2009.
The recovery started several months before the recovery in Western markets. To a significant degree the behavior of the Shanghai market has led the behavior of Western and Asian markets.

Many people out of habit follow the Dow, but the Dow increasingly follows Shanghai, but with a lag of several months.
The Shanghai index's retreat from the August 2009 high at 3400 developed two types of trend correction. The first was a strong correction in price, with a fall of more than 10 percent. This was followed by the development of a sideway consolidation trend correction. The broad outline of this pattern of behavior is a China cup pattern.
The index activity does not exactly match the curve trend lines of the cup, but it remains a powerful behavior pattern in the index. Weekly charts are used for strategic analysis. They are not used for tactical trading analysis.
The China cup pattern develops when a market overheats. Some investors begin to buy as the market falls because they believe the long-term trend is strong. When the market rebounds it is investor buying that helps to push the price up. This is steady accumulation buying behavior and the developing trend is contained within the cup pattern.
The China cup does not have a handle. The China cup pattern develops after a retracement from an extended uptrend. This pattern is created when there is strong investment activity. It is a very bullish pattern and shows strong trend continuation. The depth of the cup is measured and projected upwards. This sets the first upside target near 4200.
The common variation of this pattern in Western markets is a cup and handle pattern. This pattern is created when there is a high level of trading activity. In this pattern the price reaches the lip of the cup and then develops a retreat.
The retreat pattern is called a handle. It develops because traders develop some doubts about the strength of the long-term trend. They sell, and this causes the small price retreat. Then other traders see an opportunity for a rebound and they buy.
In the cup and handle pattern the price target is measured from the point where the price moves above the upper edge of the handle pattern. The breakout above the handle of the cup is usually rapid. Once the pattern price target is achieved, the price often retreats rapidly and the uptrend fails.
The China cup chart pattern is a trend continuation pattern so the target calculation is used as a minimum target level. The behavior of the trend move towards and beyond this target is variable. It may be a steady up move, or the trend may include a rally and retreat pattern of behavior.
Inside this China cup pattern on the Shanghai Index there has recently developed a strong up-sloping trading or channel. The lower edge of the trend channel starts from the October 2009 low. The upper edge of the channel includes the October and November 2009 highs. This trading channel provides an indication of how the breakout continuation trend may develop during the first part of 2010.


The cup pattern may develop into a cup and handle pattern. This would include a handle pattern retracement and a fall towards support at 3000, as the handle pattern develops. In this situation the upside target calculation is used as a target level. Once the index achieves the target then there is a higher probability of a trend consolidation at the target level.
The China cup and the cup and handle patterns are bullish trend continuation patterns and show a good market outlook for 2010.
The author is an international financial technical analysis expert and is known as "The Chart Man".