Daryl Guppy
Psychology able to affect price of gold
By Daryl Guppy (China Daily)
Updated: 2010-01-18 08:04
 |
Large Medium Small |
Ancient alchemists tried to create gold from a diverse mixture of common elements. The behavior of the gold price is the result of a diverse mixture of modern common elements. These include the strength or weakness of the US dollar. It includes the timing of the inevitable rise in interest rates in Europe, America, and other countries such as Australia. Added to this mixture is the strength of the Chinese economy and global reactions to increases in bank capital reserve ratios. Of course, the fundamentals of supply and demand are also added to the mixture. This is an effervescent combination that adds volatility to the behavior of the gold price.

It is possible that gold can reach $2,000 an ounce as predicted by some American analysts. The unique features of the gold market make it more difficult to reliably estimate the price targets for gold in 2010.
The price of gold is not directly correlated to the fundamentals of demand and supply, such as the seasonable increase in Indian jewelry demand. The gold price is directly linked to the strength or weakness of the US dollar. This is also linked to political decisions about interest rate policy in America. The behavior of the gold price is mainly created by emotional and psychological behavior when traders and investors react to political decisions
The key psychological feature on the gold chart is the long-term resistance level near $1,000 an ounce. It's a magical figure for some traders and the breakout above this level inspired the strong emotional-driven rally towards the peak at $1,220.
The nature of the gold price rally above $1,000 was defined with a fast moving parabolic trend line. The end of this trend in Dec 2009 creates a new set of conditions for the market.
The parabolic trend line has three important features. First, it shows extreme emotion and a separation from the underlying supply and demand fundamentals. Second the trend has a defined ending date when the line moves towards vertical. Third, the collapse of a parabolic trend is usually dramatic and rapid. Price fell rapidly below the parabolic trend line.
Parabolic trend collapses are often very severe and drop the price by around d 50 percent or more. The trend collapse may be interrupted by strong rallies, but the downside objective remains in place. This type of behavior was clearly seen with the collapse of the parabolic trend in oil prices in 2007.
A rebound rally developed from near $1,080. This rally has been strong but the rally did not develop from an historical support level. During the price rise, the parabolic trend fails to develop any strong consolidation areas which may later act as support or resistance points. Rally rebounds have a high probability of failure when they do not develop from confirmed support levels. The price retreat from the rally high of $1,160 is consistent with the rally failure.
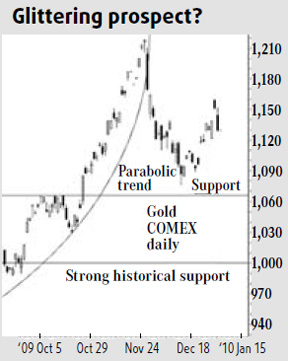
A 50 percent fall from the parabolic trend peak gives a downside target near $1,040. This is between the two main support areas shown on the weekly gold chart. The higher support area is near $1,068. This is a weak support area calculated from the resistance levels created in 2009, October. The strongest historical support level is near $1,000.
There is a high probability the market will retest support near $1,068. There is a lower probability the market will fall to support near $1,000. The key feature for strong uptrend continuation is the confirmation of a support area with a successful retest of support. This provides a base for a sustainable uptrend. A rebound from this firm support level has an initial target near previous highs at $1,220. This is now a physiological resistance point for the next rally. The future development of rally and retreat patterns in the next several weeks will provide the technical tools for calculating further upside targets beyond $1,220.
The gold market delivers fast moving rally opportunities and there is the potential to develop new parabolic trend behavior.
The sky is the limit in charting terms, but remember that gold comes from deep holes in the ground. Sentiment and politically driven retreats can drop gold back to below $1,000.
The author is a well-known international financial technical analysis expert and is known as "The Chart Man".
(China Daily 01/18/2010 page14)