
The old market relationships for gold used to be simple. When the US dollar was weakening, the gold price went up. When the US dollar strengthened, the gold price fell. These simple certainties seem to have vanished from the gold market. Other more significant factors are influencing the price and trend behavior.
The gold price has been historically influenced by three main factors - currency hedging, jewelry demand and central bank activity. To these factors we add a fourth - the activity of Exchange-Traded Commodity Funds.
The use of gold for currency hedging goes hand in glove with central bank buying activity. Investors move into gold when they fear currency debasement or inflation. When fiat paper currencies are under threat then gold is the instinctive hedge. Investors worried about holding euros, and also worried about the weakness in the US dollar start buying gold. The collapse in the gold price from $1,924 in September to $1,541 in October coincided with a rapid increase in US dollar strength from $0.74 to $0.79 on the US Dollar Index.
The developing weakness in the euro, and the potential collapse or restructuring of it, is the main driver behind the current gold rally.

Gold in large quantities is difficult for individuals to store so there has been an increase in demand for third party exposure to the market. This is provided by the Exchange-Traded Commodity Funds. Some of these ETCFs hold physical gold. They buy or sell in response to the demands of their clients. Other ETCFs provide gold exposure by using derivative and futures contracts. The most important effect has been to increase the participation of retail investors in the gold market. This may have contributed to price volatility. The ETCFs now account for a significant proportion of gold trading activity and their investors are not motivated by the same concern as professional traders or gold industry participants.
Underpinning this investment behavior is the consistent buying by central banks as they seek to build reserves to protect their currency. Central bank buying is usually covert. The market may guess at the activity of central banks, but this is usually not confirmed, if at all, until several months after the event. In 2010 and 2011, central bank buying provided a firm foundation for the prolonged upward trend. There is no evidence to suggest that central banks will become sellers in the near-term future so this upward trend support remains in place.
Against this backdrop the seasonal changes in jewelry demand have become less important in driving price. This combination of factors has created a strong and sustainable upward trend in gold.
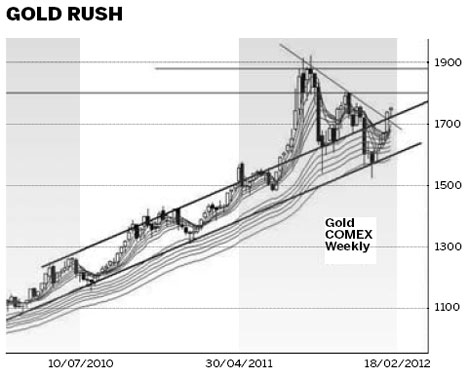
The weekly COMEX gold chart shows a strong trading channel. Starting in April 2010, the lower trend line defines the lower edge of the trading channel. The upper edge of the trading channel is confirmed in May 2010. The current rebound rally starting from near $1,570 uses the lower trend line as a rebound point.
Between May 2010 and July 2011 the gold price moved in a rally and retreat pattern inside the trading channel. The strong breakout above the upper edge of the trading channel developed in July 2011. After the peak near $1,924 in September 2011, the gold price developed a new downward trend. In October and November the upper edge of the trading channel acted as a support level. The rebound rally in October provided the anchor point for the new downward trend line.
The rebound rally that has developed from the December 2011 low near $1,560 has two important features.
The first feature is that the rally has moved above the upper edge of the trading channel near $1,720.
The second feature is the price has also moved above the value of the downward trend line, which also has a value near $1,720.
This breakout above two important resistance features is very bullish. The first upside target is near $1,800. This is the peak of the November 2011 rally and it is a weak resistance level.
The width of the trading channel is calculated and this value is projected upward to provide the second breakout target. This is near $1,860 but there is a high probability the price will use the previous resistance level near $1,880 as a target level.
The long established pattern of trend development inside the trading channel suggests that any breakout toward $1,800 and $1,880 will have the characteristics of a rally rather than a sustainable trend. This provides short term trading opportunities. In the longer term the gold price may return to trading inside the trading channel.
The author is a well-known international financial technical analysis expert.
(China Daily 02/06/2012 page14)
 Domestic auto lineup looks overseas
 Electric car industry in the slow lane
 Brighter days for solar power
 Market flat, Japan-brand sales plummet